Contact: iono@oma.be
Event: 2016-09-19
SUMMARY OF THE EVENT: A rapid increase of TEC from 10:00(UTC) until its maximum 12:45(UTC) was observed. Above Brussels, it corresponds to a maximum increase of 103% with respect to the median of the 15 previous days. The origin is not well determined, as the geomagnetic distrubances were moderate (maximum K of 3 at Dourbes).
 Figure 1: VTEC Time Series |
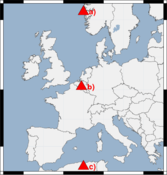
 Figure 2: VTEC extracting locations |
|
Figure 1 shows the time evolution of the Vertical Total Electron Content (VTEC) (in red) extracted from the near-real time VTEC maps at 3 different latitudes (Figure 2): a) Northern part (top), b) Brussels (middle) and c) Southern part (bottom). Also shown, the model based on the median from the 15 previous days (in grey). About this event, see also:
|

